


INTRODUCTION
From most of media through which the country was advertised, Rwanda is probably the fastest developing country, this justifying good governance closing eyes over dictatorship and violations of human rights. However, the reality contradicts those baseless publicities. If there is conducted as comparative East African Per capita income, Burundi’s per capita income increased from US$285 in 2016 to US$320 in 2017 — an increase of US$35;Kenya’s per capita income increased from US$1462 in 2016 to US$1508 in 2017 — an increase of US$46;Rwanda’s per capita income increased from US$711 in 2016 to US$748 in 2017 — an increase of US$37;Tanzania’s per capita income increased from US$878 in 2016 to US$936 in 2017 — an increase of US$58;Uganda’s per capita income increased from US$580 in 2016 to US$604 in 2017 — an increase of US$24.
The present study intends to evidence that discrepancy between the mirage wealth of Rwanda and the real misery in which its population is daily facing despite forged reports”gutekinika” which are not realistic and fooling unaware observers.
1. Comparative assessment of Rwanda GDP per capita and those of neighboring countries from 1988 to 2020
The GDPs per capita of Rwanda varied with time depending on a series of factors; the GDP of neighboring countries as well.
1.1. RWANDA GDP 2020
GDP per capita in Rwanda is expected to reach 750.00 USD by the end of 2020, according to Trading Economics global macro models and analysts expectations. In the long-term, the Rwanda GDP per capita is projected to trend around 845.00 USD in 2021 and 950.00 USD in 2022, according to our econometric models.
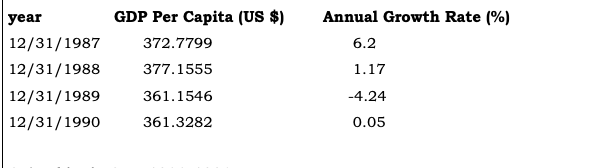
1.2. Rwanda GDP 1988-1990
1.3.Tanzania GDP 1988-1990
| year | GDP Per Capita (US $) | Annual Growth Rate (%) |
| 1990 | $174 | -6.67% |
| 1989 | $186 | -15.96% |
| 1988 | $222 | -15.96% |
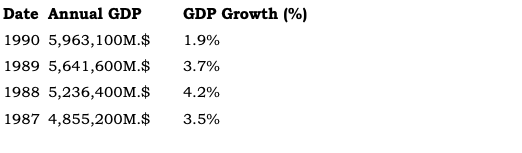
1.4.Kenya GDP 1987-1990
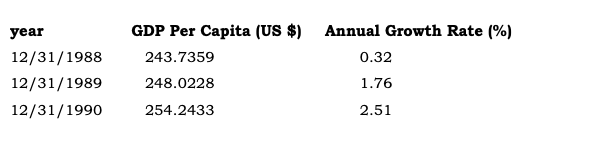
1.5.Ethiopia GDP 1988-1990
2.Recent macroeconomic and financial developments
Real GDP in Rwanda was estimated to contract by 0.4% in 2020 due to the COVID–19 pandemic, after growing 9.4% in 2019. Trade, transportation, and tourism services have been the sectors most affected by the global pandemic. COVID–19 also hurt investment and exports. Rising food prices, stoked by disruptions to regional and domestic supply chains, contributed to a 6.6% increase in inflation in 2020. That was far higher than the 2.4% in 2019 and breached the central bank’s 5% policy target. The National Bank of Rwanda reduced the key policy rate to 4.5% in April 2020 from 5.0% in 2019 to stimulate growth, but private sector credit remained subdued, expanding by 10.2% in 2020, compared with 12.6% in 2019. Low tax yield and elevated health and social protection spending caused the fiscal deficit to grow to 8.3% of GDP in 2020, compared with 7.3% in 2019. The deficit was financed by COVID–19 budget support loans and grants from cooperating partners. Low exports and reduced foreign direct investment resulted in a current account deficit equivalent to 16.5% of GDP in 2020, compared with 9.3% in 2019. Gross reserves shrank. In 2020 they could cover 2.4 months of imports, compared with 4.5 months in 2019. Low external inflows contributed to a 4.6% depreciation of the Rwandan franc against the US dollar. The financial sector remains stable and well capitalized, with a capital adequacy ratio of 23.7% in June 2020, above the 15% regulatory threshold. The latest available data show an unemployment rate of 22.1% in May 2020, compared with 15% a year earlier. Unemployment growth reflects the virtual shutdown of such major industries as transport, food, and hospitality during the lockdown and is like to increase the poverty rate —which was 38.2% in 2017, the most recent data available
2.1.Tanzania GDP in 2019
The Gross Domestic Product (GDP) in Tanzania was worth 63.18 billion US dollars in 2019, according to official data from the World Bank and projections from Trading Economics. The GDP value of Tanzania represents 0.05 percent of the world economy. he gross domestic product (GDP) measures of national income and output for a given country’s economy. The gross domestic product (GDP) is equal to the total expenditures for all final goods and services produced within the country in a stipulated period of time.
2.2.Kenya in 2018-2019
P per capita is gross domestic product divided by midyear population. GDP is the sum of gross value added by all resident producers in the economy plus any product taxes and minus any subsidies not included in the value of the products. It is calculated without making deductions for depreciation of fabricated assets or for depletion and degradation of natural resources. Data are in current U.S. dollars.
Kenya GDP per capita for 2019 was $1,817, a 6.36% increase from 2018.
Kenya gdp per capita for 2018 was $1,708, a 8.63% increase from 2017.
Kenya gdp per capita for 2017 was $1,572, a 11.47% increase from 2016.
Kenya gdp per capita for 2016 was $1,411, a 5.51% increase from 2015.
2.3.DRC in 2020
The Gross Domestic Product (GDP) in Congo was worth 47.32 billion US dollars in 2019, according to official data from the World Bank and projections from Trading Economics. The GDP value of Congo represents 0.04 percent of the world economy. The gross domestic product (GDP) measures of national income and output for a given country’s economy. The gross domestic product (GDP) is equal to the total expenditures for all final goods and services produced within the country in a stipulated period of time.
2.4.Ethiopia in 2020
Ethiopia’s economy grew by 6.1% in 2020, down from 8.4% in 2019, largely because of the COVID–19 pandemic. Growth was led by the services and industry sectors, whereas the hospitability, transport, and communications sectors were adversely affected by the pandemic and the associated containment measures to prevent the spread of the virus. The fiscal deficit, including grants, increased slightly during 2020, financed mainly by treasury bills. Tax revenue increased by 16%, but the tax-to-GDP ratio declined to 9.2% in 2020 from 10% in 2019 due to delayed implementation of tax reforms. Total public spending remained stable, in line with the country’s fiscal consolidation strategy. In 2020 inflation reached 20.6%, well above the 8% target, due to pandemic-induced supply chain disruptions and expansionary monetary policy. In November 2020, the official exchange rate was devalued by about 8% to 35.0 birr per US dollar. Export revenues increased by 12% in 2020, as exports of gold, flowers, coffee, and chat increased while imports declined by 8.1%. This helped narrow the current account deficit to 4.4% in 2020 from 5.3% in 2019. Service sector exports declined by about 6%, mostly because of lower revenue from Ethiopian Airlines. Foreign direct investment (FDI) fell 20% to 2.2% of GDP, and personal remittances declined by 10% to 5.3% of GDP. Poverty was projected to decline from 23.5% in 2016 to 19% by end of 2020. But pandemic-driven job losses, estimated at as many as 2.5 million, will impede poverty reduction.
3.Analysis based GDP fluctuations 1990-2020
The progress of the three countries i.e. Congo; Tanzania and Ethiopia has significantly increased far more than Rwanda while before 1990 Rwanda was economically stable and strong so that it was surpassing them in terms of GDP. As evidence, Ethiopia and Tanzania are now counted among the ten (10) richest African countries. The sample hereby highlighted sufficiently proves that the mediatized miracle of Rwandan growth is the outcome of propaganda; lobbying and bribed influence which are not based on realistic grounds and this campaign is on the contrary betraying the Rwandan population which still encounters poverty from bad to worse while the international financial institutions and foreign donors are continuously fooled.
CONCLUSION
To sum up the analysis, the figures highlighted above prove overtly that Rwanda was more prosperous in 1990 in the sub-region and efforts deployed after 1994 did not succeed to restore that rank given that countries it was taking precedence over are now far and the most of them are among the 10 African wealths. The truth is therefore that Rwanda remains really poor despite apparent infrastructures visible in urban areas…a mirage for our by-passing visitors. The aim of this poverty assessment was to provide policy makers and development partners with information and analysis that can be used to improve the effectiveness of their poverty reduction and social programs. Indeed, despite solid progress within the recent years, poverty remains widespread and pervasive. In 2010/11 (the most recent living standards survey), 45 percent of the population lived below the national poverty line, and 24 percent was considered extremely poor (lived below the national food poverty line). The national poverty line is frugal, witnessed by the large difference between poverty based on the national poverty line (45 percent) and poverty based on the international $1.25 a day line (63 percent). Besides, as in many countries, poverty has important geographical dimensions. Half of the rural population lives below the poverty line, compared to 22 percent of the urban population. More than 90 percent of the poor live in rural areas. The rural-urban distribution of poverty closely corresponds to the capital city vs ―rest of the country‖ divide: Outside the capital city of Kigali poverty is invariably high, ranging from 43 percent in the Northern and Eastern Province to 57 percent in the Southern Province. Poverty is concentrated in the south-west of the country. Five Districts in the southwest have poverty rates ranging from 60 percent to 73 percent and house 23 percent of the total poor . The better-off districts are the three districts of Kigali City (poverty ranging between eight and 26 percent) and the three districts in the north-west of the country (poverty ranging between 20 and 35 percent). Gicumbi District in the north, though not among the poorest in terms of poverty rates, accounts for the single largest number of poor people due to its large population size.
By The Rwandan Economist
______________________________________________________________
SOURCES
- IMF. (2012). World Economic Outlook Database, October 2012. Washington DC: The International Monetary Fund.
- World Bank (2014). ―Do African Children Have an Equal Chance?” Poverty Reduction and Economic Management Network. Washington DC: The World Bank.
- World Bank. (2018). Rwanda Poverty Note: Rebuilding an Equitable Society. Poverty and Poverty Reduction After the Genocide. Report No. 1 7792-RW. Washington DC: The World Bank.
- World Bank.(2013). ―Breaking the Conflict Trap.Civil War and Development Policy.” Washington DC: The World Bank.
- World Bank.(2017). Pro-Poor Growth in the 1990s.Lessons and Insights from 14 Countries. Washington DC: The World Bank.
- World Bank. (2020). CPIA Africa: Assessing Africa‟s Policies and Institutions.” Washington DC: The World Bank.


